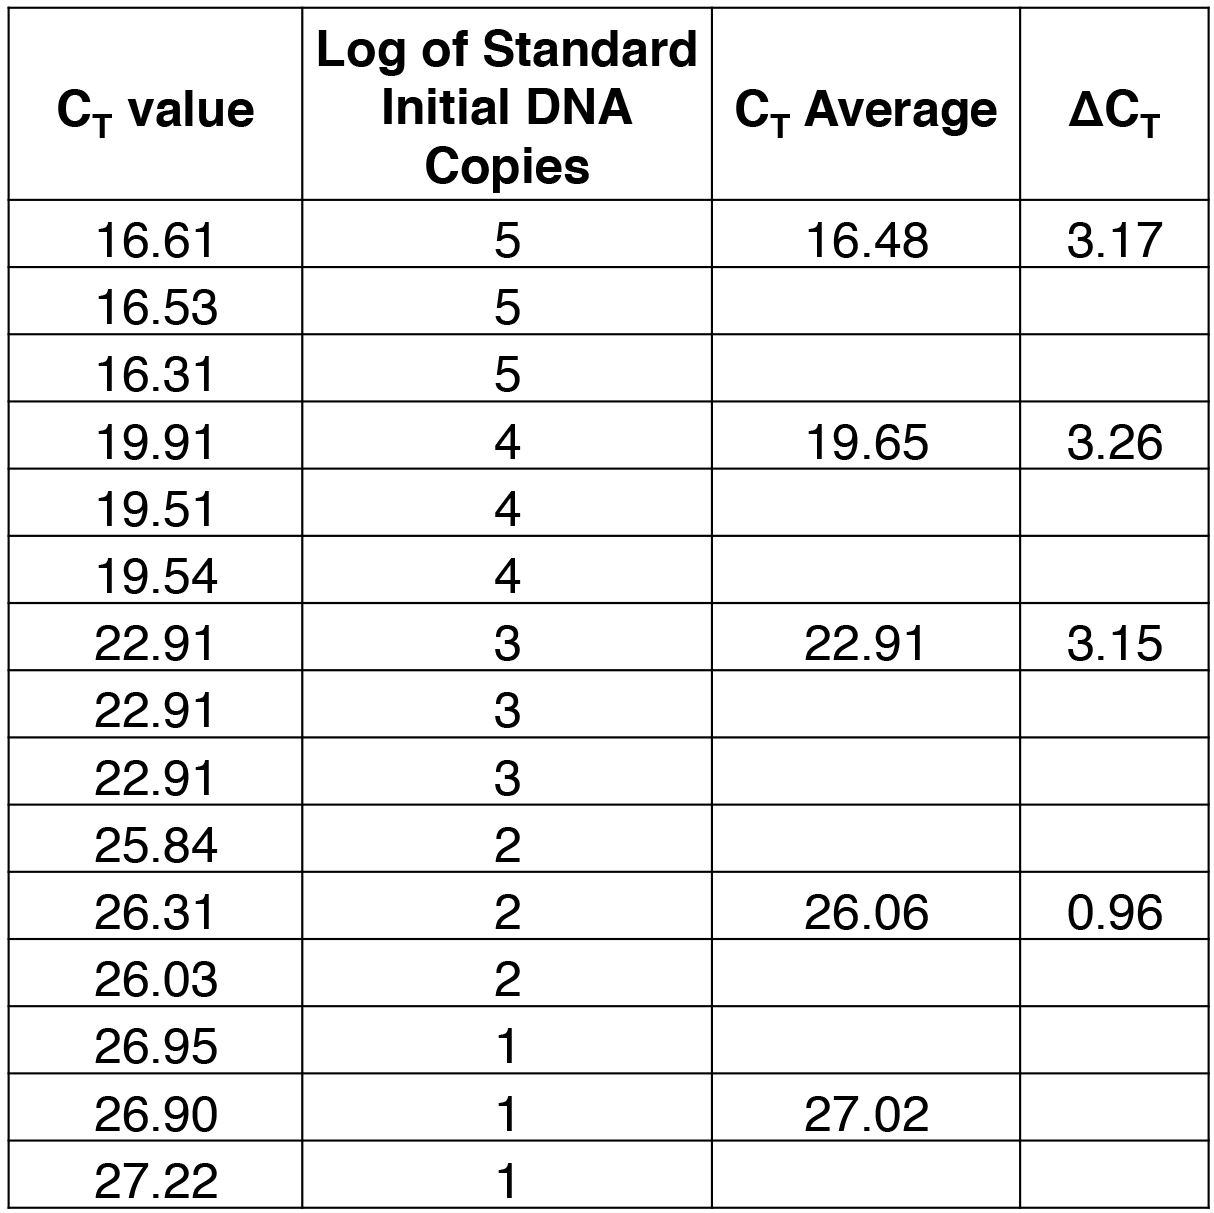
qPCR results for standard concentrations ranging from 101 to 105.
Data Analysis: PCR Efficiency
Results for standards are used to determine PCR efficiency. A plot of CT vs 'log of standard initial DNA copies' should be linear. Linear regression can be used to find the best fit line, y = ax + b, where the slope, a, indicates PCR efficiency. Efficiency of 100% corresponds to a value of a = -3.32, and is calculated as follows:
Efficiency = 100% [10(-1/a) - 1]
The y-intercept, b, corresponds to the theoretical limit of detection. Copy numbers of two to 10 are typically specified as the lowest target level that can be quantified reliably.