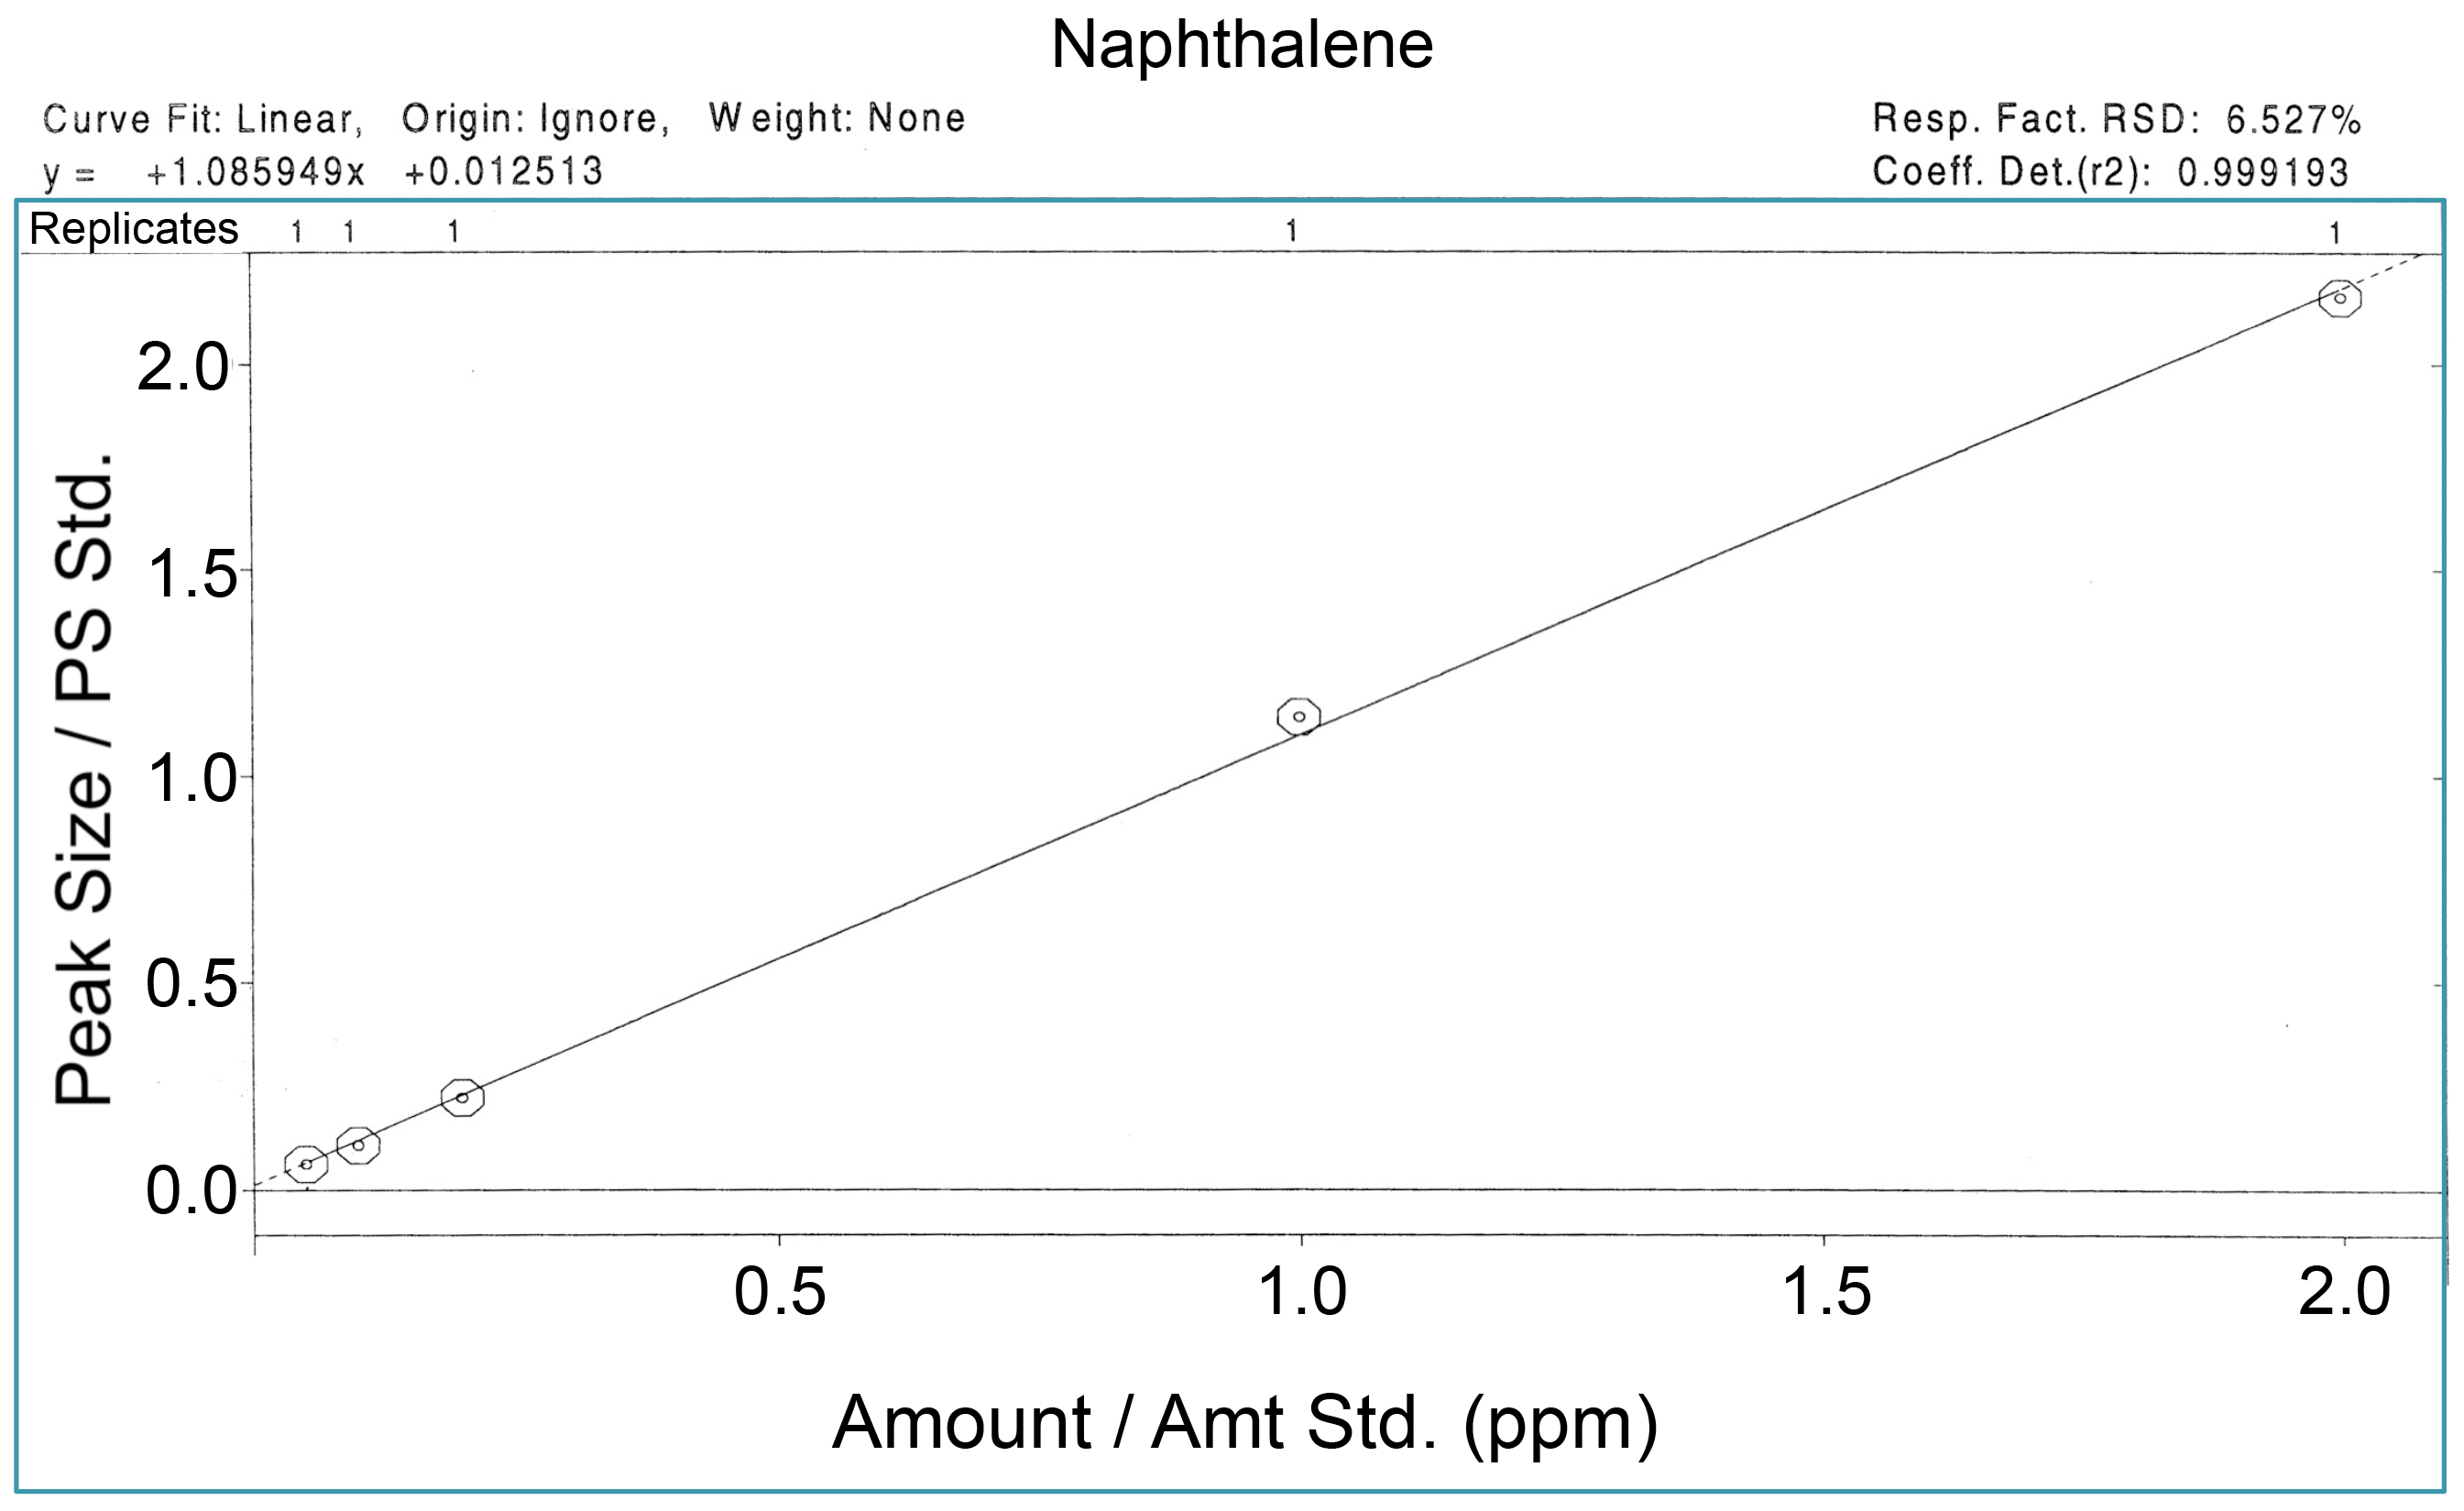
GC/MS Calibration Curve
Quality Control: Data
Analyte measurement quality depends upon on a large number of factors during sample collection, analyte extraction and analysis.
- Written protocols help to minimize procedural variation.
- Quality control samples ensure measurment fidelity. For example:
- Standard reference materials contain a known amount of analyte(s), and can be used to evaluate the performance of an analytical method.
- Recovery may be determined from a standard reference material or a spiked sample. Usually less that 100% of the known concentration is measured, but sometimes values may be greater than 100%. Note that no correction for recovery is made in reported values; measurements from an analytical method are deemed acceptable if the recovery value is within a specified range, e.g., 80% or greater.
- Laboratory blanks with measureable analyte(s) indicate possible cross-contamination in a column or other parts of an instrument.
- Regular instrument calibration ensures measurement accuracy.
- A detection limit may be determined from a calibration curve with repeated measurements at each concentration. The detection limit is a value above which the signal from an analyte is measureable and distinguishable from the background signal (see section 2.5.6 in Fifield and Haines, 2000 and Ch. 9 in Taylor, 1987). Measurements below a detection limit are usually coded as non-detects.